November 2006 Archives
2006-11-29 16:32:50
Complete Mining of Frequent Patterns Graphs: Mining Graph Data
I found this paper on CiteULike. I am interested in it because it might has an application on network motif, although their algorithm is obtained by the extension of Apriori algorithm which is an algorithm of Data mining.
In this paper, we propose a novel principle and an algorithm that can capture all ``frequent induced subgraphs'' and ``association rules among induced subgraphs'' which are observed in many transactions where each is a general graph.
We proposed a new algorithm by extending the Apriori algorithm to mine frequent induced subgraph structures in graph transaction data. The algorithm can handle general graphs and perform a complete search efficiently.Agraph can be either directed or undirected, and have any number of labels for nodes and links and any loops including self-loops.
However the problem to search induced subgraph isomorphism is very hard to do.....2006-11-24 22:07:37
Graphs Connectivity
Here is my slides.
Prof. Tang was too tired so that he nodded almost whole report. Therefore I thought it is hard to discriminate that Prof. Tang like my report or not, although he said it is good after meeting.
2006-11-23 14:48:54
Parameterized Algorithms and Complexity at CCU
Speaker:Prof. Peter Rossmanith
Theoretical Computer Science, Department of Computer Science, RWTH Aachen University
I can't attend this mini-course, but Joseph gave me the slides of this course. Thanks a lot!
Prof. Rossmanith started at figures about NP-Complete, I liked it very much at that time I read Garey and Johnson. Computers and Intractability.

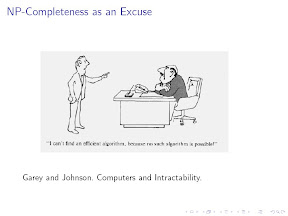
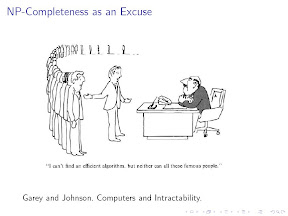
And he quoted the words of Molecular biologist Joseph Felsenstein:
About ten years ago, some computer scientists came by and said they heard we have some really cool problems. They showed that the problems are NP-complete and went away!
That's why we should study the Parameterized Algorithms.
2006-11-22 15:50:46
Slides for Graph Meeting
Topic: Graphs Connectivity
Paper: Testing Connectivity of Graphs, Hsuan Chang Chen, Master thesis, Graduate Institute of Computer Science and Information Engineering , NTU, 2006.
2006-11-21 23:46:34
Two researchers
2006-11-17 21:13:46
A survey of the role of multicommodity flow and randomization in network design and routing
Ref.: Srinivasan, A. An Extension of the Lov{\'a}sz Local Lemma, and its Applications to Integer Programming. SIAM Journal on Computing, Vol. 36, 609-634, 2006. [ArXiv][SODA1996]
I knew this book at last semester. In this semester I need to report Lovasz Local Lemma, so that I found this paper again.
2.4 Flow-decomposition and randomized rounding
Ref. :Network flow From Wikipedia, the free encyclopedia
Flow Decomposition is a simple and useful process of transforminh ``edge flows'' to ``path flow''.
According to the definition on Wikipedia. A network flow is a real function
The procedure to transform f into a set of ``path flow'':
-
find any path P_1 from s to t that is composited by only positive-flow edges;
find the minimum flow value b_1 of edges of P_1;
substract the b_1 from all edges of P_1, and declare P_1 to be a flow-path with flow value b_1, then remove the edges of P_1 which are with zero flow value.
Repeat!
Moreover, we could generalize it into a multi-commodity flow problem, you have multiple sources and sinks, and various ``commodities'' which are to flow from a given source to a given sink. This could be for example various goods that are produced at various factories, and are to be delivered to various given customers through the same transportation network, i.e., to find each flow-path P_{i,j} on (s_i,t_i).
There are serval ways with randomized rounding. First one is to send a unit flow from s_i to t_i. Since such paths P_{i,j} will be convex combination, we could pick P_{i,j} indepednet at ramdon for each i, and the probability of each P_{i,j} is set as b_{i,j}. The second one is like first one but the probability of each P_{i,j} is set as proportional to b_{i,j}.
3. Low congestion rounding, minimax integer programs, and Lovasz local lemma
Note: the explaination of minimax integer program is not lucid in this paper.
The congestion is defined as the maximum number of chosen paths using any edge of G which is minimized. This problem, that choose one P_{i,j} for each i to minimize congestion, could be formulated by minimax integer problems.
Definition An MIP (minimax integer program) has the variables W and
a system of linear inequalities $Ax\leq W'$, where $A\in [0,1]^{m\times N}$ and W' is the m-dimenional vector of the variable W in each component,
Note, from constraints (i) and (iii) of MIPs, that for all i, any feasible solution will make the set
The first approach for this problem is LP relaxation of MIP by modifying contraints to non-negative reals. Let $x^*,y^*$ denote the optimal solution and optimal value of LP relaxation of MIP respectively, thus $y^*\leq OPT$. Then one independently picks exact one x_{i,j} rounding to 1 at random like the first approach of maximal flow with the probability x^*_{i,j}.
(Not finish)
Ref.: Network Flows: Theory, Algorithms, and Applications, by Ravindra K. Ahuja, Thomas L. Magnanti, James B. Orlin, Prentice Hall (February 18, 1993)
2006-11-17 00:23:33
Predicting the Effectiveness of Naive Data fusion on the Basis of System Characteristic
My Labmate, PhD candidate, Chun Yi Liu gave this talk in Lab Meeting at 2006-11-02.
The main ideas of Data Fusion are socring and ranking. Data fusion is useful for many fields. It could merge the result of different methods (or databases).
There are some main questions for data fusion.
-
Under what condition , performance of C is better than performance of D ?(D.F.Hsu and I. Taksa,Information Retrieval 8,(2005))
What kind of combination E of A and B is guaranteed to be better than A and B (or under what condition)?
Under what condition , performace of C (or D)is better than th performace of A and B?
They proposed two conditions for effective data fusion, i.e., Diversity and Similarity. And they gvae the experimental results based on Parametric Statical Methods.
Diversity and Similarity denoted as z and r respectively, then by Multiple Liner Regression Analysis, they got formula 1 and by Linear Discriminant Analysis they got formula 2.
It implies that the effectiveness of data fusion is improved if Diversity and Similarity is improved.
My idea is that (not finish)
2006-11-16 22:54:28
20061110 Graph Meeting Power domination in block graphs
Power domination: Let G = (V,E) be a graph representing an electric power system. A PMU measures the state variable (voltage and phase angle) for the vertex at which it is placed and its incident edges and their endvertices. (These vertices and edges are said to be observed.) We will introduce the observation rules[1] in the following.
1. Any vertex that is incident to an observed edge is observed.
2. Any edge joining two observed vertices is observed.
3. If a vertex is incident to a total of k >1 edges and k-1 of these edges are observed, then all k of these edges are observed.
This paper gave algorithm based on cut-tree. Since they could build cut-tree of block graph, they try to classfy it into sub-problems, i.e., path, spider, and strong support vertex which adjacent to two or more leaves is called a strong support vertex.
Since it is easy to solve the cases of path and spider on cut-tree, the remaining is to solve the case strong support vertex. It is also easy if we solve it base on bottom-up approach that computed MPD by deciding sub-MPD of path, spider, and strong support vertex iteratively.
After the meeting, Prof. Sheng-Lung Peng also mentioned that Parameterized Algorithms and Exponential algorithms might be the good research direction.
The former is like the graph algorithms, it try to introduce some more general parameters to intactable problem and to find the tractable cases with certain parameters of such problems, but graph algorithms classfy the by sub-graphs.
The later is for some situiations that does not allow the approximation solution. They faced the intractability of problems and tried to devise the algorithms with acceptable time complexity, such as $(1.2)^n$.
2006-11-02 10:25:53
2006 Computational Systems Biology Lecture Series I: Hamid Bolouri
The first one is the introduction of tools they developed. The second introduce the electric circuit model for genetic regulatory networks. They adapt the electric circuit model because electric circuit is nonlinear and with feedback. Actually I am interested in network motifs because of this talk.
After browsing some results in networks motifs, I quested that ``what is the meaning of netwotks motifs and what could we do on biological networks by it?'' U. Alon, et. al. said
The fact that the network motifs appear at frequencies much higher than expected at random suggests that they may have specific functions in the information processing performed by the network.
(Network motifs in the transcriptional regulation network of Escherichia coli Nat Genet, 2002, 31, 64-68.)Is it the FACT? It might be a seminal idea, but not a fact.
Hamid Bolouri answered the question in this talk, ``we cannot guess function from topology alone.''
There are many examples, one is the electric circuits which consisted of transistors have simple topology but complex and nonlinear phenomena.
He also intrduced the recent studys of networks motifs. I thought that is a good reference.
2006-11-01 21:55:31
Regression Analysis
Regression in Wikipeida.
In statistics: * The phenomenon, that, when two related variables are measured, the expected value of the second is closer to the mean than the measured value of the first. See regression toward the mean. * A method where the mean of one or more random variables is predicted conditioned on other (measured) random variables. See regression analysis. * A method of curve fitting which uses least squares: See Linear regression and Nonlinear regression
For ``regression toward the mean'' also refer here correlation coefficient which indicates the strength and direction of a linear relationship between two random variables. Sometimes we will find the low correlation between two random variables. How do we measure the credibility of such relation? That is, if we got a very low correlation coefficient like 0.2, then the assumed relation of the two random variables is sufficient or not?However I don't take those questions too serious. In TCS, statistics is not so useful. Nevertheless I need to know it, since I decided to study Macroeconomic Analysis.
In linear case, correlation coefficient = 0 means only ``no linear correlation'', and it does not mean ``no correlation.''
Even though one got the high linear correlation coefficient, it still needs to check something more. The first one should be test of significant of linear correlation, the second we could do linear regession, if we got the linear regression we also need to test it!
Above equation is Pearson's correlation coefficient which is a parametric statistic, that assumed the distribution of random variables such as normal, gamma, or possion. For Pearson's correlation coefficient, it is assumed to be normal distribution. For some cases, non-parametric correlation methods, such as Spearman's and Kendall's correlation coefficient may be useful when distributions are unknown (or don't know how to guess the distribution.)
The idea of statistical significance is that
Thus let null hypothesis H0: rho=0, alternative hypothesis H1: rho is not 0, significance level is alpha. When the sample size n of the paired data is large (n>30 for each variable), the standard error s of the linear correlation r is approximately
2006-11-01 19:15:34
Consecutive One Property
In Physical Mapping, people use Shotgun Sequencing in genetics for sequencing long DNA strands, by cloning strands then using to divide sequence-tagged site (or STS) with enzymes. Eventually they adopted the idea of Fragment Assembly to rebuild the original sequence, i.e., Shortest Common Superstring or ``Given a (0,1) matrix of probes versus clones, to reconstruct the relative places of clones or probes.'' And they are both in NP-C.


Ref. Technique: Physical Mapping of the Genome. It introduced some biological techniques in Physical Mapping.
However, if we just consider the problem, the existance of solution for permuting the columns so that the ones in each row are consecutive. It is C1P problem and is in linear time.(However I don't know why it could be linear since matrix is m*n. Transform matrxi to graph also costs m*n!)
This problem is in linear time, but even slight modeified version become in NP-C, like consecutive one submatrix, ``Given a matrix, find a column permutation such that in each row, there are at most k blocks of consecutive 1's,'' ``Given a matrix, find a column permutation such that the total number of blocks of consecutive 1's is minimized. '' (i.e., C1P with some error entries)
Mohammadtaghi Hajiaghayi wrote a paper about C1S, A Note on the Consecutive Ones Submatrix Problem, and a mannual, Consecutive Ones Property, about C1P and C1S at 2002.
In the mannual, he introduce an (new?) algorithm for solving C1P.

In the algorithm, A is a clique-vertex incident matrix. A' is the matrix modified from A, and each column of A' is maxiaml, and A' is C1P iff A is C1P. The A' could be obtained by add an identity matrix below A, i.e., append I, a n*n matrix, to m*n matrix, such that A' is (m+n)*n matrix.
G[A'] means the adjancy matrix of A'. CLex-BFS is an algorithm, that is a modifed Lex-BFS perfering chosing nodes with largest degreee, in Construction of a simple elimination scheme for a chordal comparability graph in linear time, Discrete Applied Mathematics, Volume 91, Issues 1-3, 26 January 1999, Pages 287-292, Richard B. Borie and Jeremy P. Spinrad.
This algorithm is almost linear besides construct the A'.
Wen-Lian Hsu wrote some papers in this problems. W. L. Hsu, "A simple test for the consecutive ones property", Journal of Algorithms 43, (2002), 1-16. W. F. Lu and W. L. Hsu, A Test for the Consecutive Ones Property on Noisy Data - Application to Physical Mapping and Sequence Assembly, Journal of Computational Biology 10(5), (2003), 709-735.
Ron Shamir also wrote some good notes about it, Algorithms in Molecular Biology: Physical Mapping, and Advanced Topics in Graph Algorithms: Lecture #11 Interval Graphs.
2006-11-01 15:39:39
Specificity and Stability in Topology of Protein Networks
To address topological properties of these two networks, we quantified correlations between connectivities of interacting nodes and compared them to a null model of a network, in which all links were randomly rewired.
To test for correlations in connectivities of nodes for each of the above two networks, we calculated the likelihood P(K0,K1) that two proteins with connectivities K0 and K1 are connected to each other by a link and compared it to the same quantity Pr(K0,K1) measured in a randomized version of the same network.
To further quantify and compare correlation patterns in interaction and regulatory networks, we calculated the average connectivity
However, I don't know the meaning of results.
 Above graph is the physical interactions of proteins.
2006-11-01 14:43:48
Network motifs in the transcriptional regulation network of Escherichia coli
We evaluated the statistical significance of the network motifs by comparison with randomized networks having the same characteristics as the real E. coli network. The probability that a randomized network had an equal or greater number of each of the motifs than the E. coli network was determined by enumerating the motifs found in 1,000 randomized networks.
Rroughly speaking, their method is based on comparing with randomized network. What do them mean and could we do with those network motifs?The authors gave two instructions, the first is
The fact that the network motifs appear at frequencies much higher than expected at random suggests that they may have specific functions in the information processing performed by the network.
Is it the FACT? It might be a seminal idea, but not a fact. The second one seems much useful.Additional insight may be gained by mathematical analysis of their dynamics.
Mathematical analysis suggests that the coherent feedforward loop can act as a circuit that rejects transient activation signals from the general transcription factor and responds only to persistent signals, while allowing a rapid system shutdown. This can occur when X and Y act in an 'AND-gate'−like manner to control operon Z (Fig. 2a), as is the case in the araBAD operon in the arabinose feedforward loop (Fig. 1b)15.
mathematical analysis suggests that SIMs can show a detailed temporal program of expression resulting from differences in the activation thresholds of the different genes (Fig. 2b). Built into this design is a pattern in which the first gene activated is the last one to be deactivated.
The motifs allow a representation of the E. coli transcriptional network (Fig. 3) in a compact, modular form (for an image of the full network, see Web Fig. A online). By using symbols to represent the different motifs (Fig. 1), the network is broken down to its basic building blocks.
Mathematical model of network motif dynamics
I don't know what Boolean kinetics is? But it seems interesting!
Ref.: McAdams, H.H. & Arkin, A. Simulation of prokaryotic genetic circuits. Annu. Rev. Biophys. Biomol. Struct. 27, 199–224
Ref.: Operon From Wikipedia, the free encyclopedia
An operon is a group of key nucleotide sequences including an operator, a common promoter, and one or more structural genes that are controlled as a unit to produce messenger RNA (mRNA).
Ref.: Cell cycle From Wikipedia, the free encyclopediaThe cell cycle, or cell-division cycle (CDC), is the series of events in a eukaryotic cell between one cell division and the next.
Roughly speaking, it is body clock of cells.